Complete Platform Guide
Discover how TheAnalystAI transforms your workflow with cutting-edge AI technology.
Edge Strategy Builder
Overview
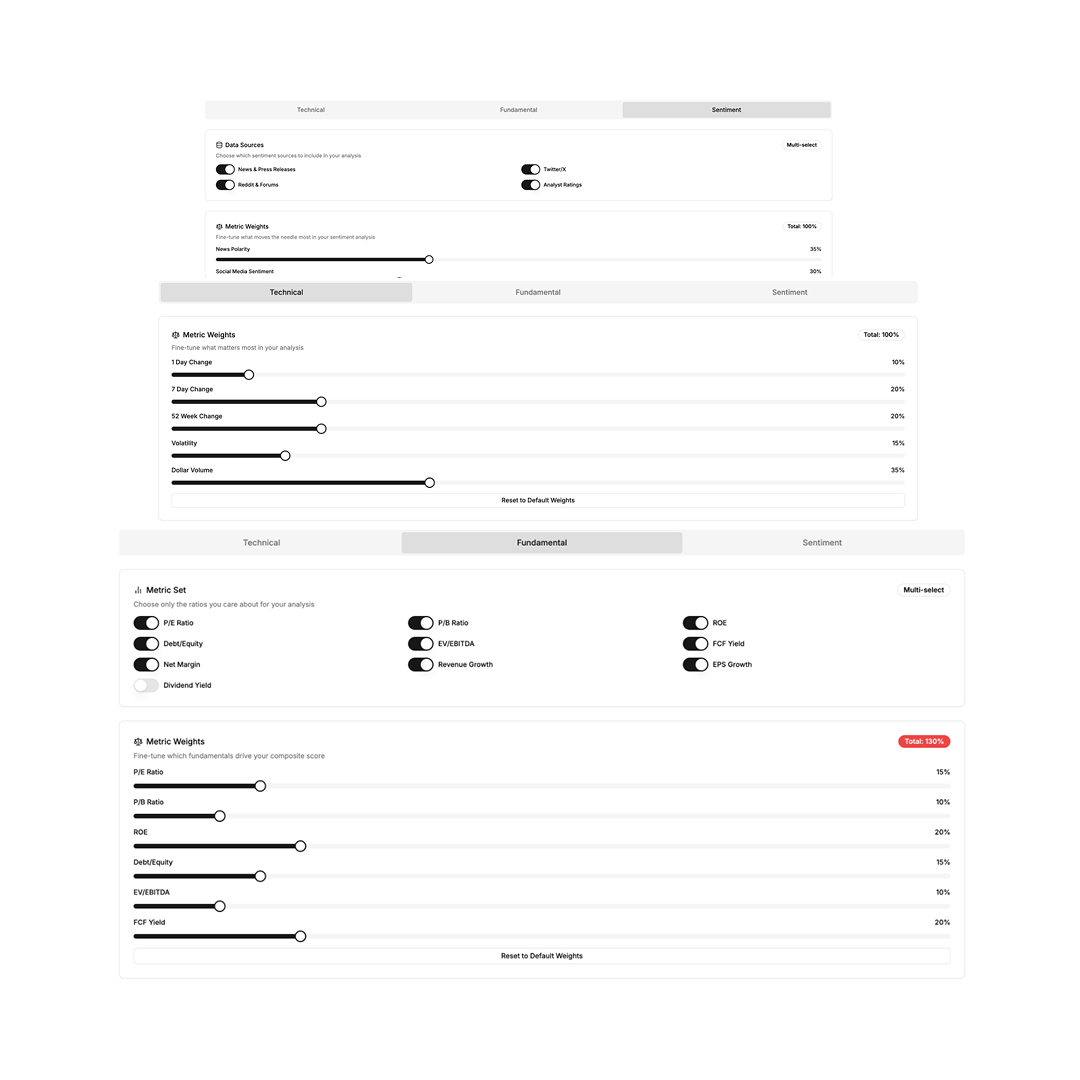
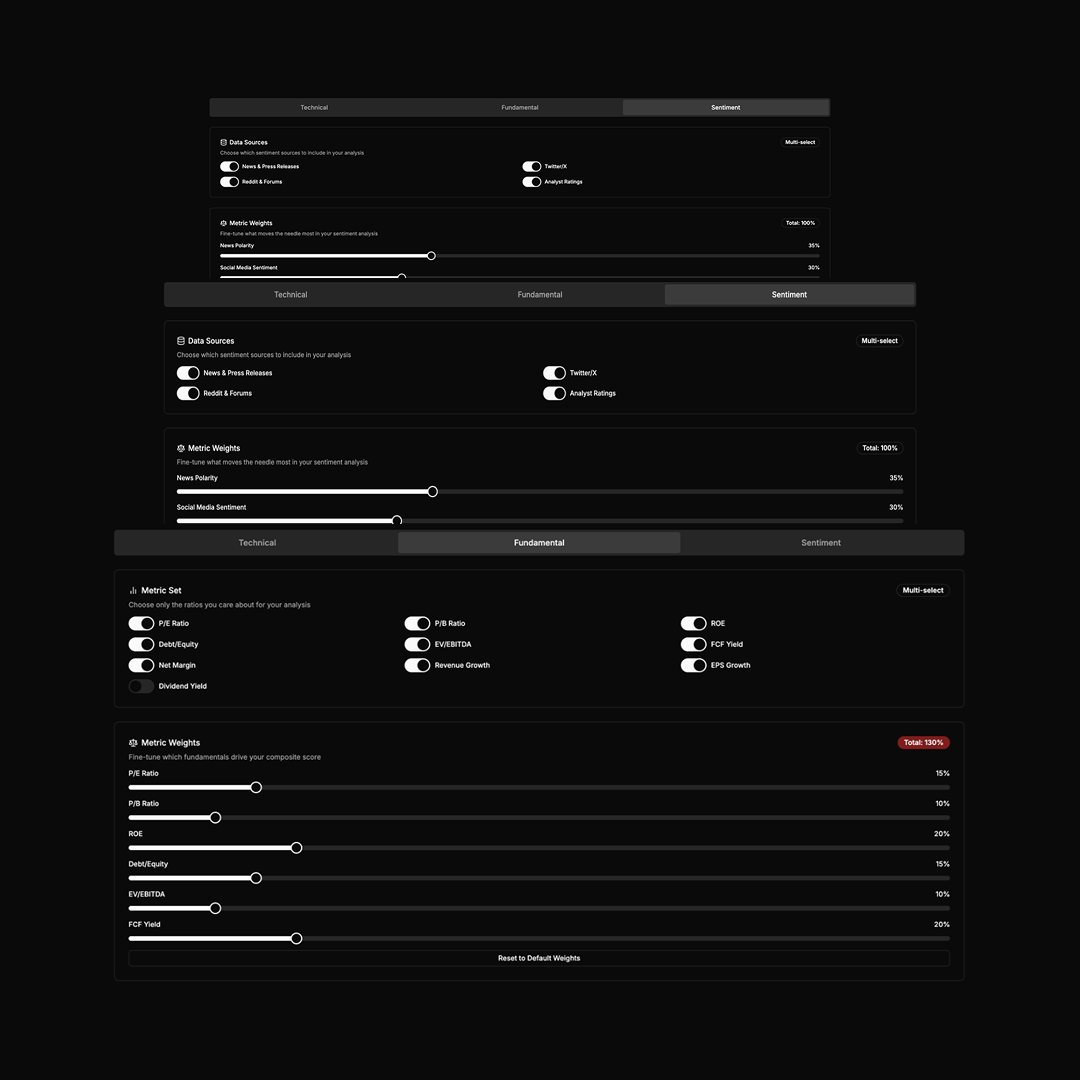
The Edge Strategy Builder lets you customize exactly how the Edge Agent ranks and selects trade ideas.
Pick which technical, fundamental, and sentiment metrics feed into your cards—and dial their weightings to match your personal strategy.
In action...
Select Metrics
Toggle on the price-change, volatility, volume, ratio, or sentiment sources you care about.
Adjust Weights
Drag sliders so the total is 100% across your chosen metrics.
Reset Defaults
Hit "Reset to Default Weights" anytime to restore our recommended balance.
Apply Strategy
Click "Apply" and the Edge Agent immediately rebuilds your swipeable cards using your new configuration.
Core competencies
Edge Explorer
Overview
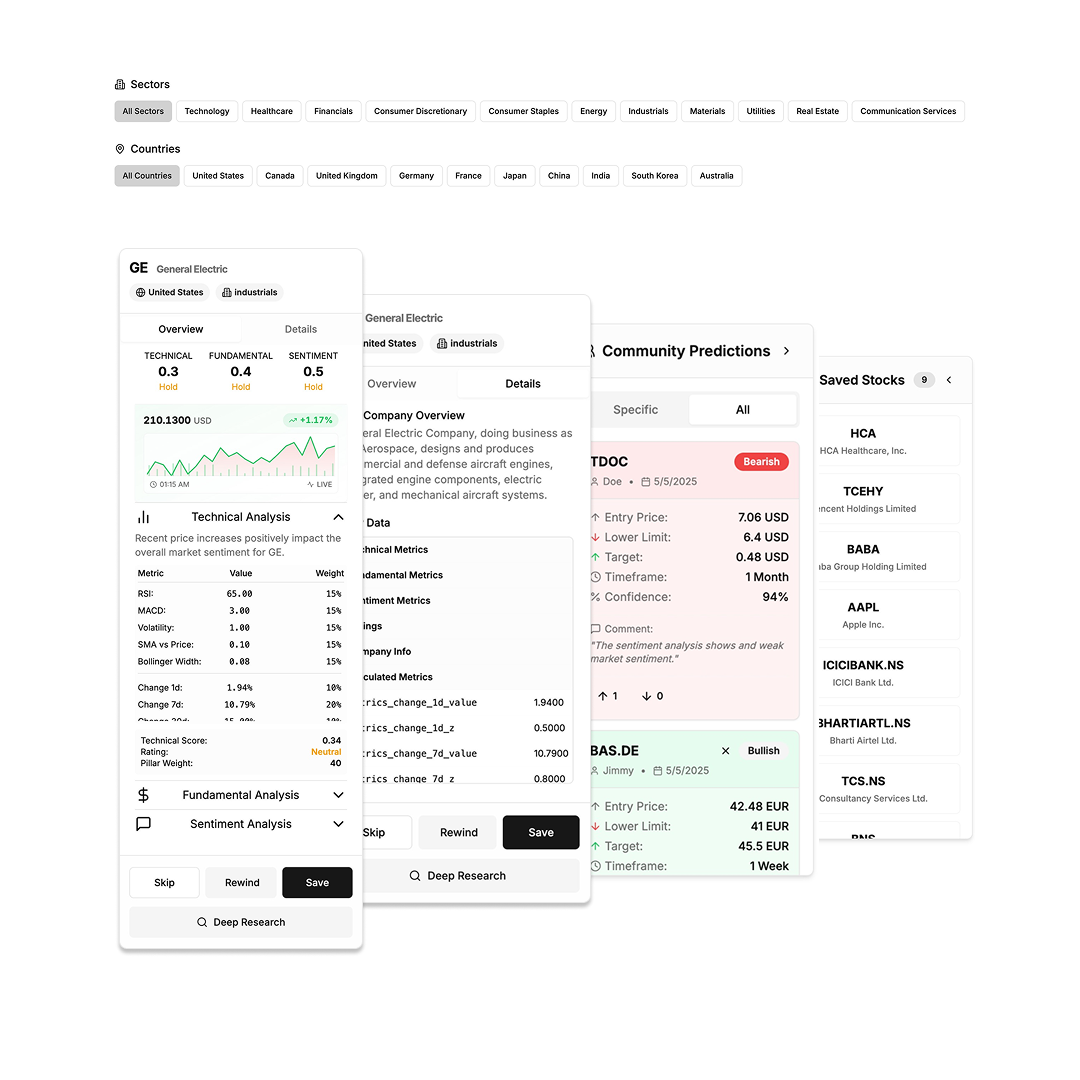
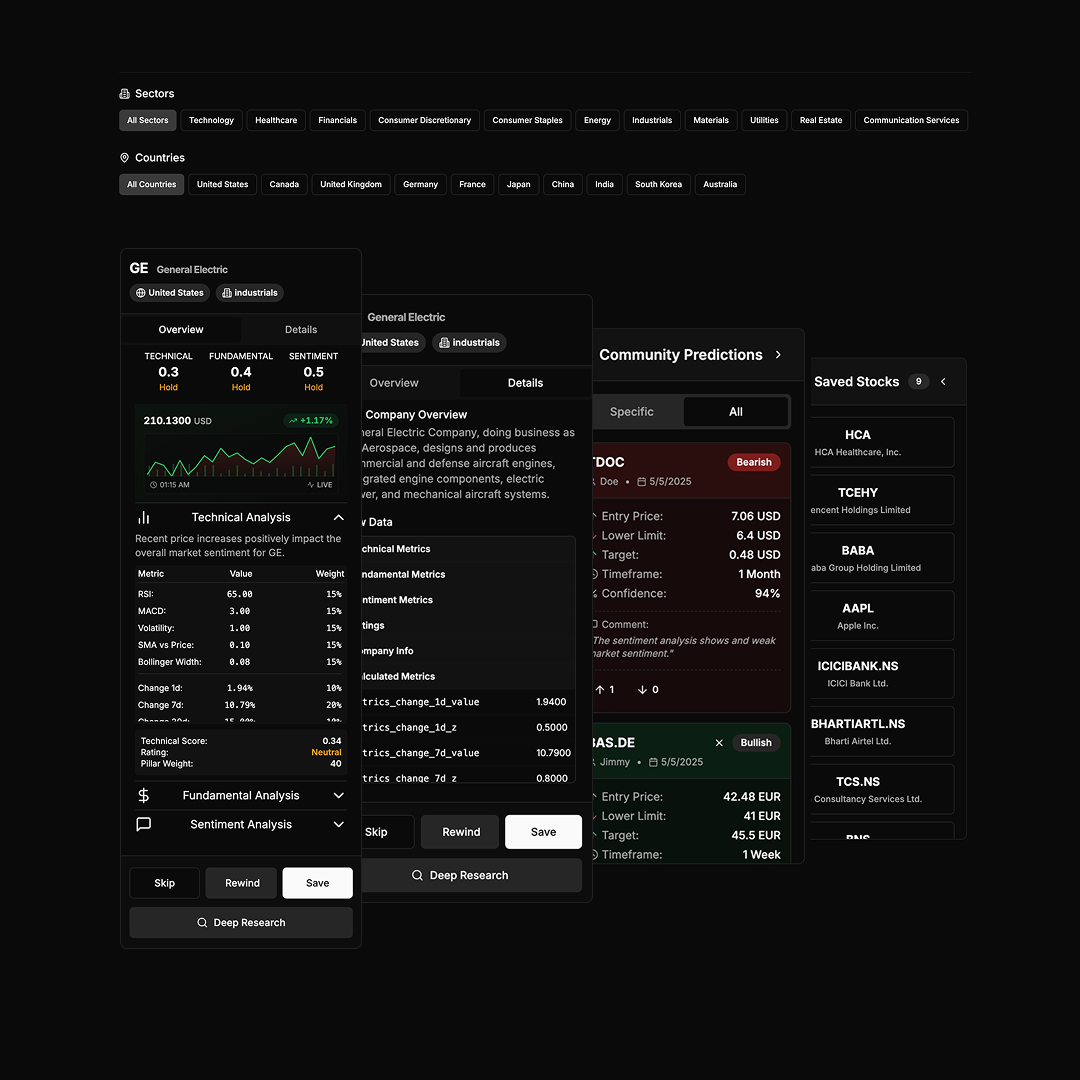
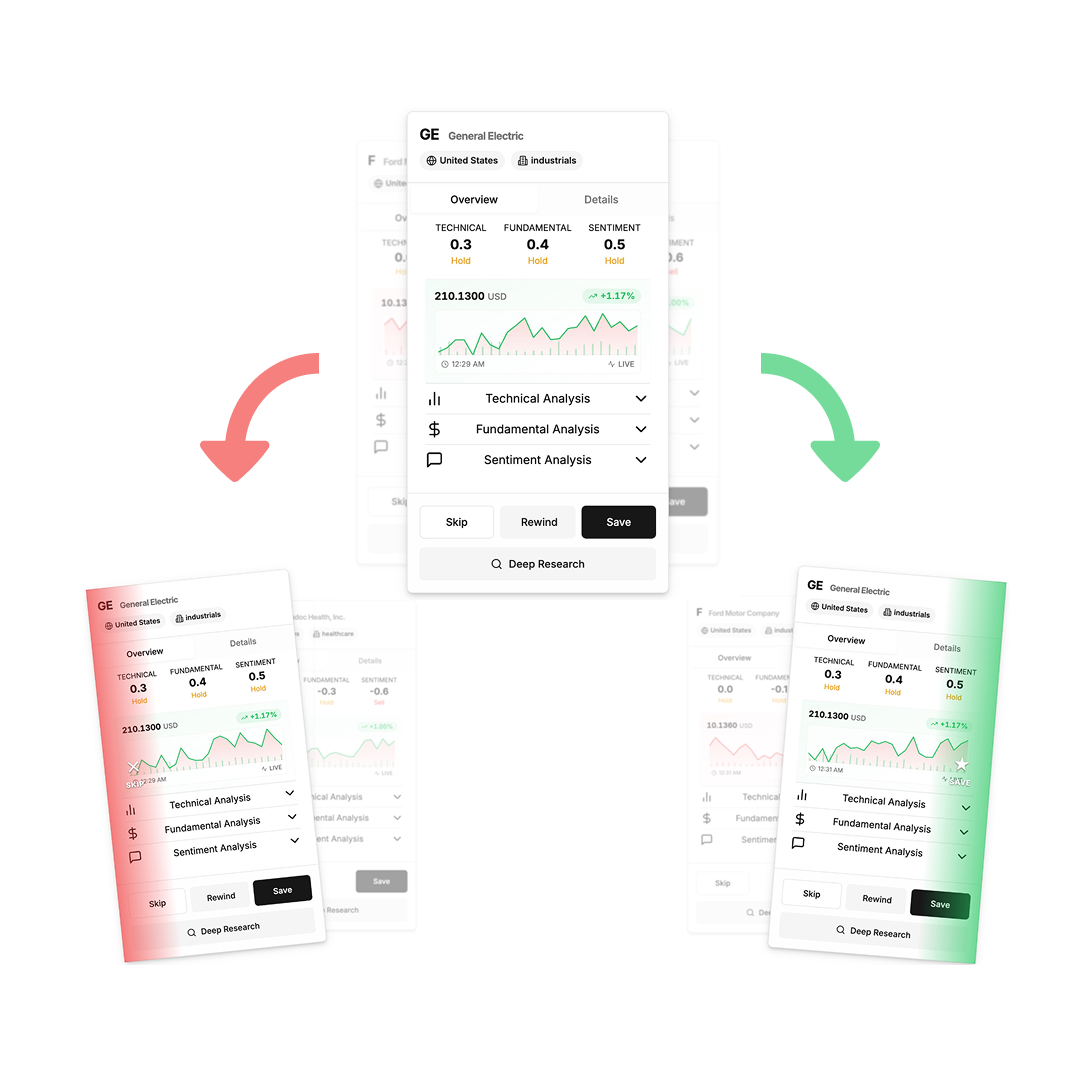
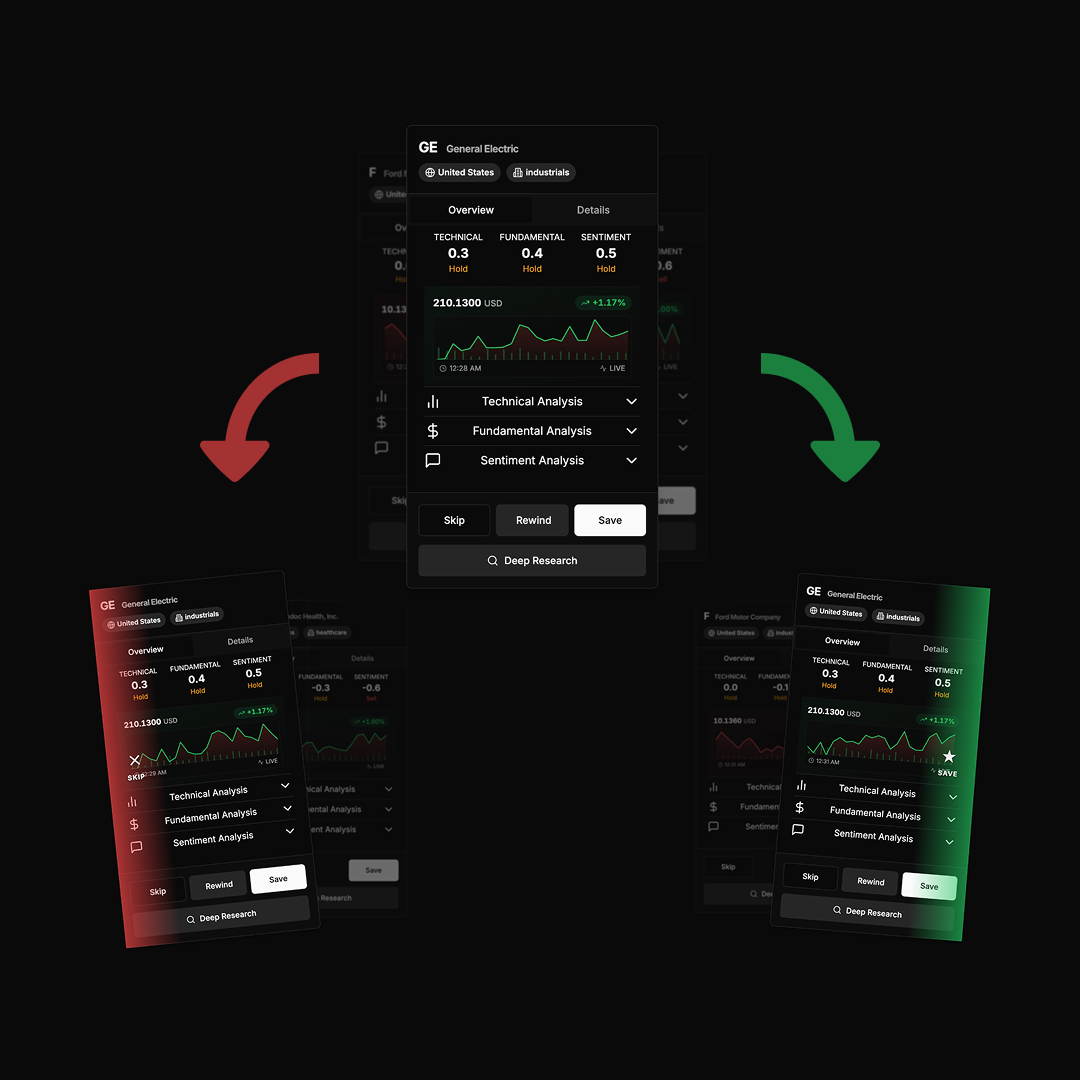
Edge Explorer empowers you to zero-in on exactly the sectors, regions, and assets you care about—and dive straight into the full Edge card insights.
Use instant filters to narrow your universe, then switch between Overview and Details for deep metric breakdowns, community predictions, and your own saved list.
In action...
- Filter Universe – Click any Sector or Country tag to instantly limit cards to your target slice.
- Overview Panel – Swipe through live Edge cards showing headline scores, price chart, and quick Save/Skip controls.
- Details View – Drill into any card for full Technical, Fundamental, and Sentiment metrics tables—plus company profile and calculated z-scores.
- Community & Watchlist – Toggle community predictions or flip to your Saved Stocks tab to see personal watchlists and crowd insights side by side.
Core competencies
Deep Research Generator
Overview
Turn any ticker—stocks, crypto, commodities or forex—into a 30+ page, AI-driven intelligence dossier in under a minute.
Our Deep Research Generator taps into real-time market feeds, public filings, news sentiment, and proprietary API signals to deliver institutional-grade analysis across every dimension you care about.
In action...
- Select Your Universe – Pick one or multiple assets and report type (Equity, Crypto, Forex, Commodity).
- Fetch & Synthesize – Behind the scenes, our agents call live price, volume, fundamentals, news & social feeds, and analyst consensus to compute time-segmented scores (1 day, 1 week, 1 month, 1 year).
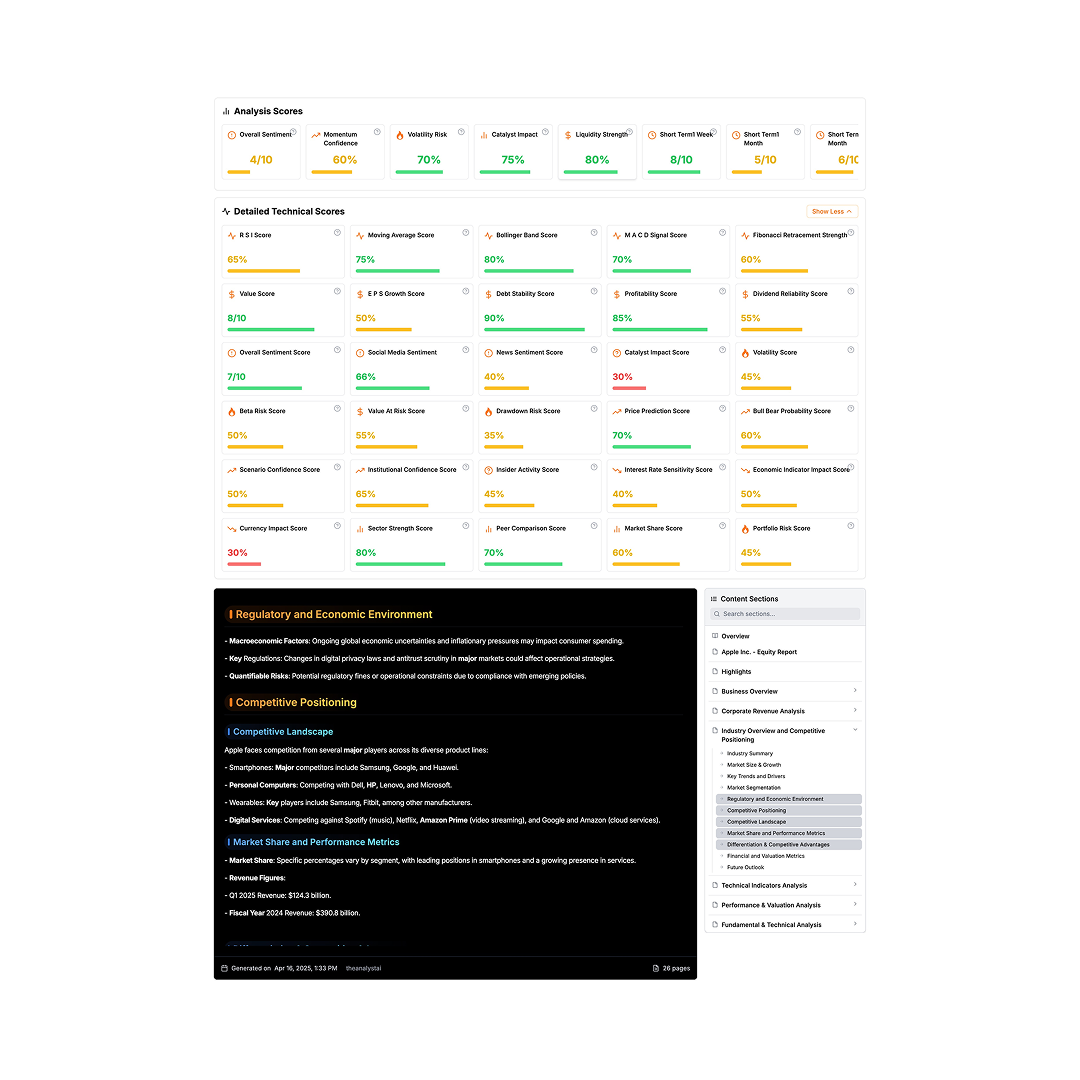
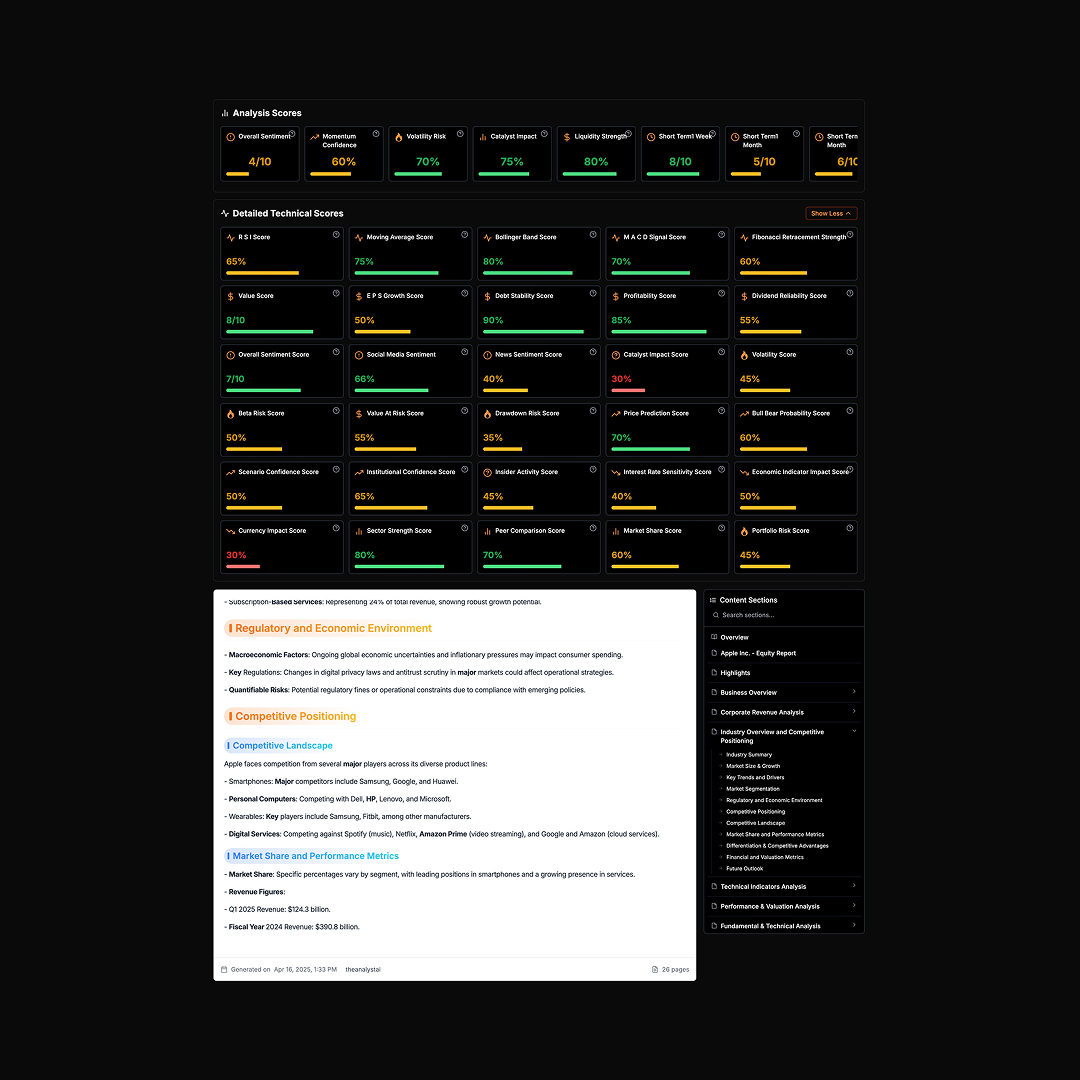
- Auto-Compose Report – Instantly generate a richly formatted document with:
- Top-line KPI tiles (Overall Sentiment, Momentum, Risk, Liquidity, Catalyst Impact)
- Expandable grids of 20+ technical, fundamental, and sentiment metrics
- AI-written narratives on macro, regulation, competition, and market positioning
- Clickable sidebar to jump to any of 30+ sections
- Export & Share – Download PDF/PPTX or share a live link for your team to review, comment, and decide.
Core competencies
Edge Cards
Overview
The Edge Agent synthesizes multi-source market signals and user preferences to generate clear, actionable investment paths.
It combines technical, fundamental, and sentiment data with risk profiles to deliver personalized strategy cards—each outlining potential returns, win probability, and recommended allocations.
In action...
A retail investor wants concise, high-conviction trade ideas for the Infra sector. The Edge Agent:
- Pulls live price, volatility, and sentiment metrics
- Scores each candidate across technical, fundamental & sentiment dimensions
- Builds four distinct paths—Low-Risk, Mid-Risk, High-Risk, and Hidden-Gem—complete with expected return, win probability, and rationale
- Presents swipeable cards to quickly Save, Skip, or Drill-Down
Core competencies
Research Suite & Comparison
Overview
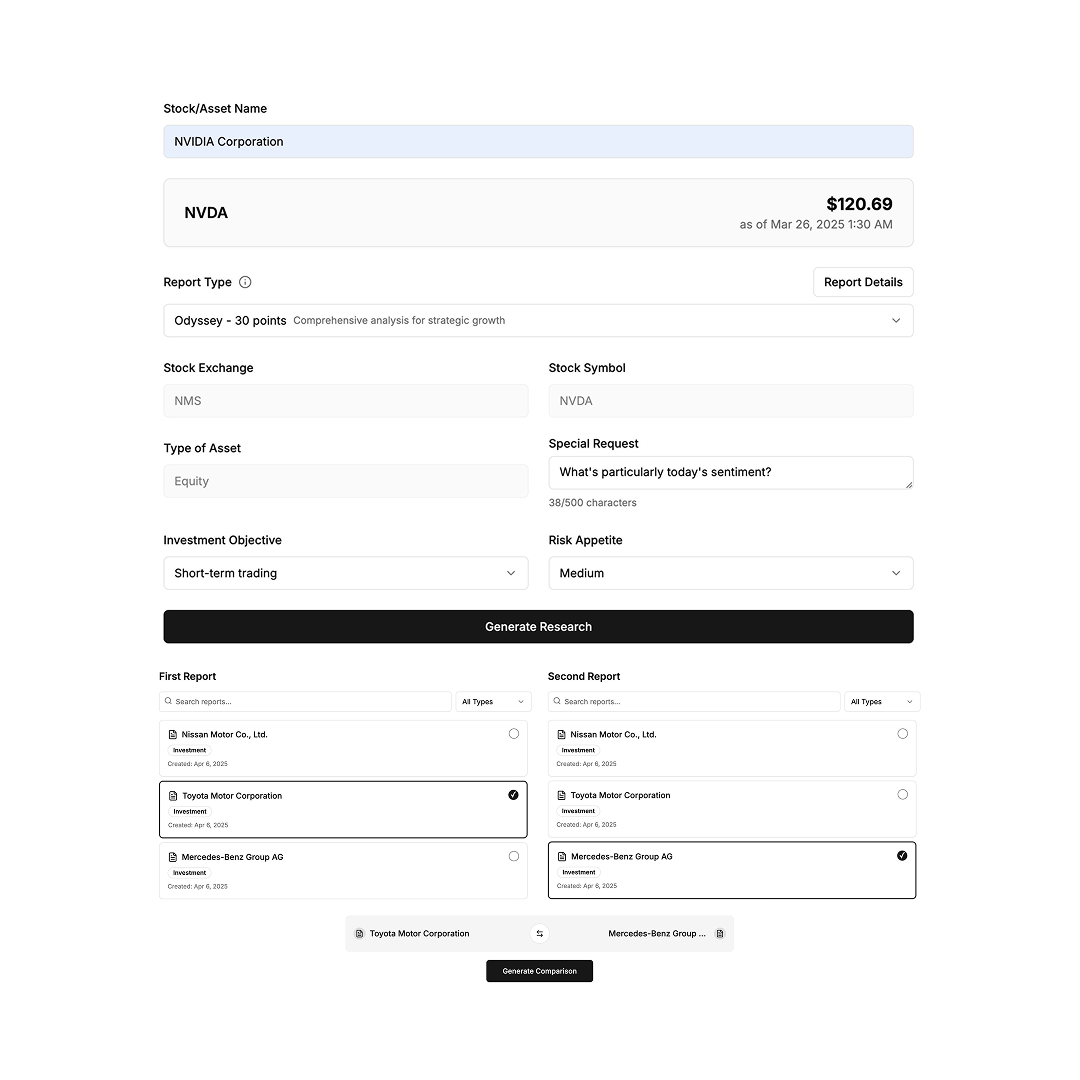
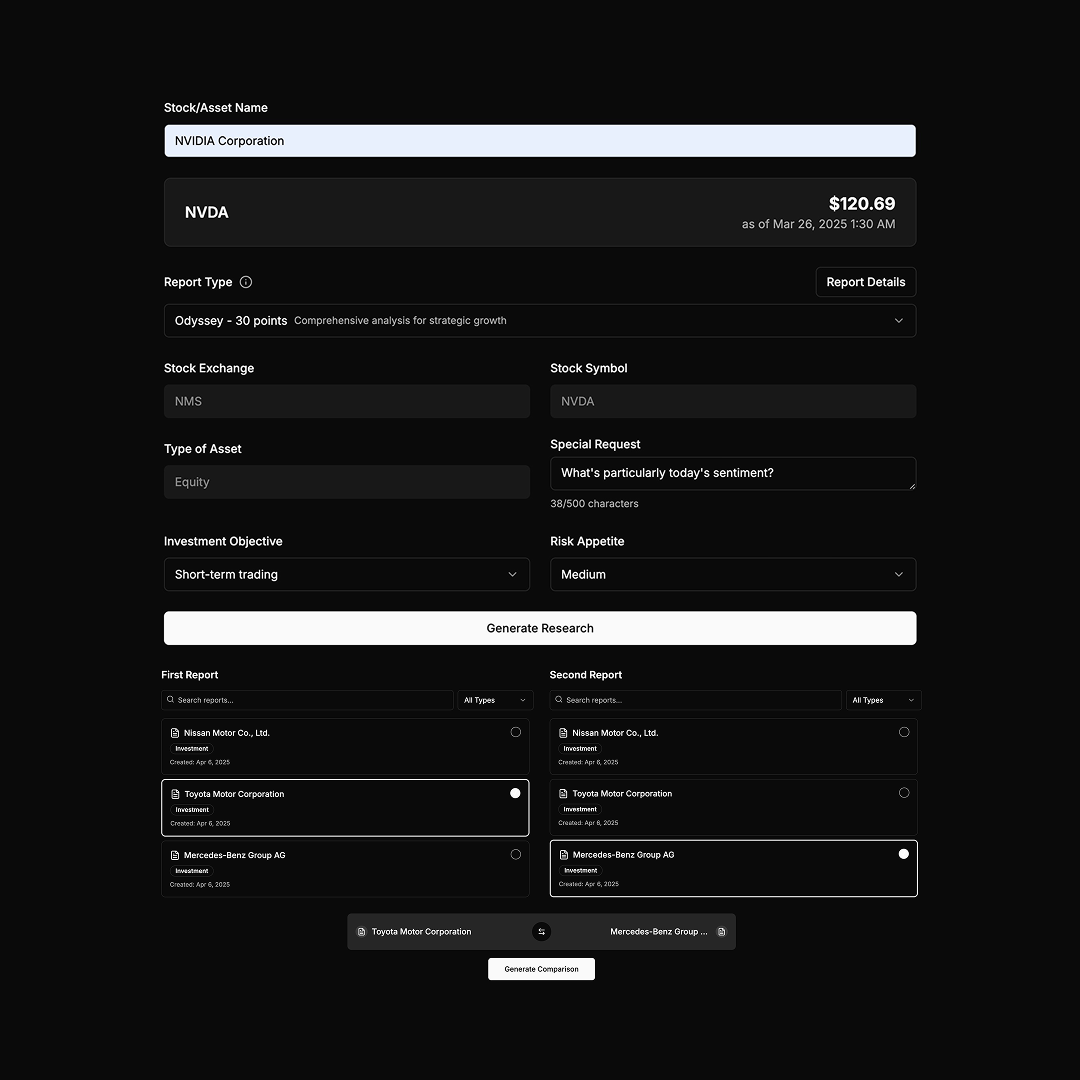
Unlock end-to-end AI research and decision support—all in one pane.
From quick-hitter Spark reports to full-blown Genesis dossiers, our Research Suite lets you spin up any analysis you need and instantly compare outputs side-by-side to pick the optimal path.
In action...
Configure Your Report
- Enter Stock/Asset name, exchange, symbol, and asset type
- Choose your Report Type:
- Spark – lightning-fast insights for quick decisions
- Flare – deeper, actionable data for tactical moves
- Odyssey – broad, strategic analysis for growth planning
- Genesis – ultimate, high-impact deep dive
- Set your Investment Objective (e.g. short-term trading) and Risk Appetite
- Add any Special Request ("Today's sentiment?")
- Hit Generate Research
Review Generated Reports
- Your new reports appear in the "First Report" and "Second Report" panels
- Filter and search across all your past reports by date or type
- See creation timestamps and asset details at a glance
Side-by-Side Comparison
- Select two reports—any combination of Spark, Flare, Odyssey, or Genesis
- Click Generate Comparison to auto-compile the key differences in scores, narratives, and metrics
- Quickly decide which approach or asset best fits your strategy
Core competencies
Multi-Tiered Analysis
Custom Inputs
Instant Organization
Automated Comparison
Insight Visualizer
Overview
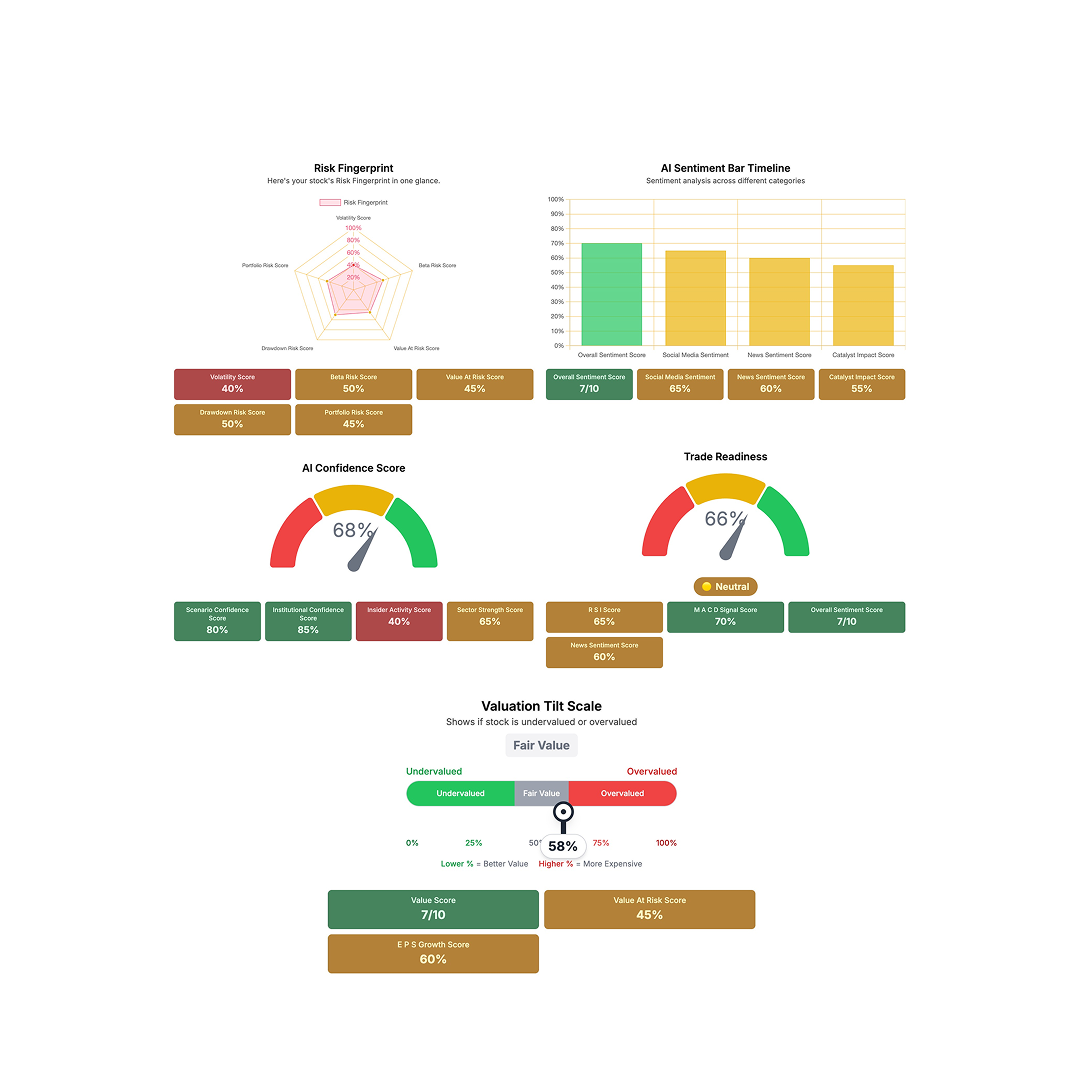
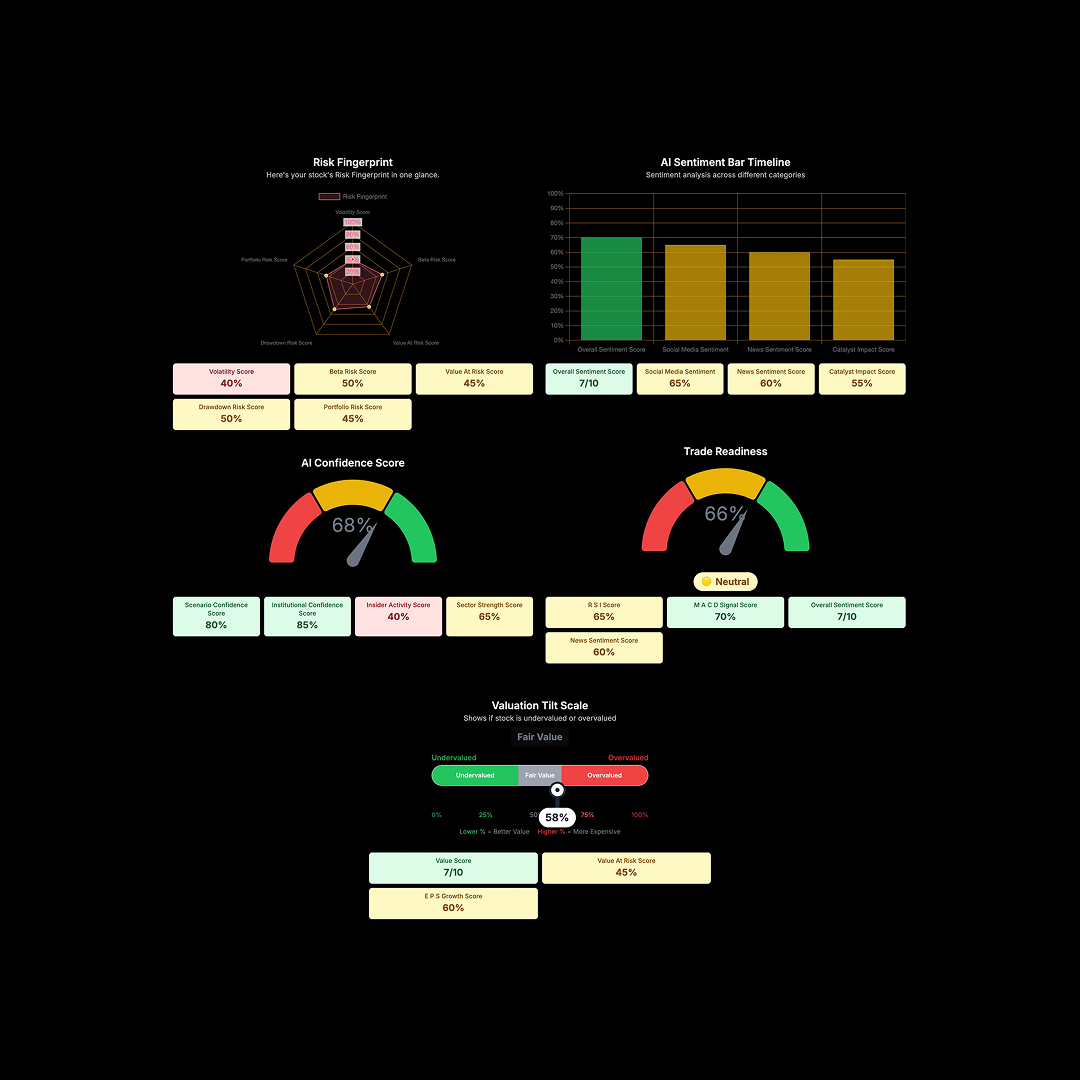
Our Insight Visualizer transforms raw market data into crystal-clear, directly actionable visuals—no candlestick charts, no clutter.
Instantly grasp risk, sentiment, confidence, trade readiness, and valuation at a glance, so you can make faster, smarter decisions without parsing endless numbers.
In action...
- Risk Fingerprint – See volatility, beta, drawdown, value-at-risk, and portfolio risk mapped on a spider chart for a unified risk profile.
- AI Sentiment Timeline – Compare overall, social media, news, and catalyst-impact sentiment in a single bar chart, revealing mood shifts over time.
- Confidence & Readiness Gauges – Two intuitive dials display AI Confidence and Trade Readiness percentages, color-coded for instant "go/no-go" signals.
- Valuation Tilt Scale – A simple slider shows whether the asset is undervalued, fairly priced, or overvalued—complete with a numeric "tilt" percentage.
- Key Metric Tiles – Below each visual, glance at the top contributing scores (e.g., EPS Growth, Value Score, Sector Strength) for immediate context.
Core competencies